
Blog
5 Great Chart Libraries for Large Datasets in JavaScript in 2026

The market for JavaScript charting libraries is huge, but for organizations building real-time dashboards, almost none of them is the right solution. The problem isn’t that developers lack the skills to implement real-time dashboards properly; it’s that these organizations simply need different software to build them.
The reality is that most JavaScript charting libraries stop working well with 100,000 data points. At this point, they can render a graph, but they do so too slowly (less than 60 frames per second), and their interaction speed is sluggish. Developers then think their code is to blame, or that their architecture needs some rethinking.
The five companies we’ve listed below handle massive datasets differently; they either utilize GPU acceleration to render hundreds of millions of data points at 60 frames per second or they simply render their data through HTML5 canvas to make rendering scalable, without sacrificing interactive speed or chart types. The difference between a “charting library” and a “large-dataset charting library” is vast, and these five companies have solved that problem.
These JavaScript libraries vary by rendering engine, how many data points they can chart, and how many chart types are offered. We chose this list based on whether they offered GPU acceleration, charted data in real-time, offered more features, or offered better developer support.
Key Features to Look for in High-Performance Charting Libraries
Real-time data requires a modern charting library. Millions of data points are sent from financial trading dashboards. Thousands of IoT sensor readings stream in.
Older rendering backends like Canvas and SVG choke. They can’t handle high throughput, lag, and freeze. You have to choose between performance and functionality. Only GPU-accelerated engines offer a production path for the enterprise browser app with 100M+ datapoints.
Performance at these scales is expected now in 2026, not an option. Charting solutions are now split: those that take advantage of GPUs and those that don’t. What’s “production ready” has been redefined. Now the only thing that matters is whether the product works well for high data volumes and can still provide smooth 60FPS animations under load.
How to Choose the Right Chart Libraries for Large Datasets
The library that won’t crash depends on how much data you’re using and how much it gets rendered. First, test each of your short-listed libraries against real data sets and the number of interactions expected with your app.
- GPU-accelerated or Canvas-based rendering: Find out if the library is GPU or Canvas-based. Request information from each library’s vendor about their benchmarking results with 100M+ points, or ask for production references.
- 60 FPS with panning, zooming, and updating data points: Confirm the library can handle real-time performance at 60 FPS without any frame drops. Ask the vendor for a live demo with the expected number of data points.
- Types of charts supported: Does the library support all the chart types you require: 2D/3D charts, geographic charts, stock/financial charts, etc?
- Framework integration: React, Angular, or Vue.js support?: Determine the level of support the library has for the JS frameworks you’re developing in, as it may have only limited 3rd party wrappers.
- Documentation and community support: How well documented is the API? What type of support does the vendor provide?
- Commercial use: Is it free? Can I use it for a commercial project? How much will it cost? What pricing model does the vendor have: free and open source, perpetual license, SaaS model, subscription, per developer, or per server?
Any library that checks all these boxes will work for both demonstration purposes and shipping into production.
Quick Comparison
Look this table up for the rendering type, limit, and ecosystem for every single library. All 5 of them can handle millions of data points; the major difference is the structure of the data and the quantity of charts offered.
| Firm | Rendering Engine | Max Datapoints (Real-Time) | Chart Types | Framework Support | Best For |
| SciChart | GPU-accelerated Vx™ | 100M+ points | 2D, 3D, financial | React, Angular, Vue | Extreme-scale real-time data |
| amCharts | Canvas-optimized | Millions | 60+ types | React, Angular, Vue | Feature-rich dashboards |
| Highcharts | SVG + Canvas hybrid | Millions | 40+ types | React, Vue, Angular | Accessible enterprise apps |
| Fusioncharts | Canvas-based | Millions | 95+ types, 1400+ maps | React, Angular | Geographic and business analytics |
| Chart.js | HTML5 Canvas | Hundreds of thousands | 8 core types | React, Vue, Angular | Lightweight open-source projects |
Top 5 Chart Libraries for Large Datasets
If you need to render millions of data points in real time, you’ll quickly discover that most visualization libraries can’t handle the load. The five libraries featured below are purpose-built or have been developed to support massive datasets by exploiting GPUs, rendering with WebGL, or dropping datapoints for performance.
Their solutions for visualizing big data vary; some focus more heavily on scientific computing and performance, while others prioritize ease of use and the ability to render a large number of chart types. And then there are the others that provide both but aren’t as easy to use.
We examined rendering capabilities and maximum datapoint counts, integration support for popular data science and development frameworks, and available pricing information, based on what we found on the public websites.
amCharts
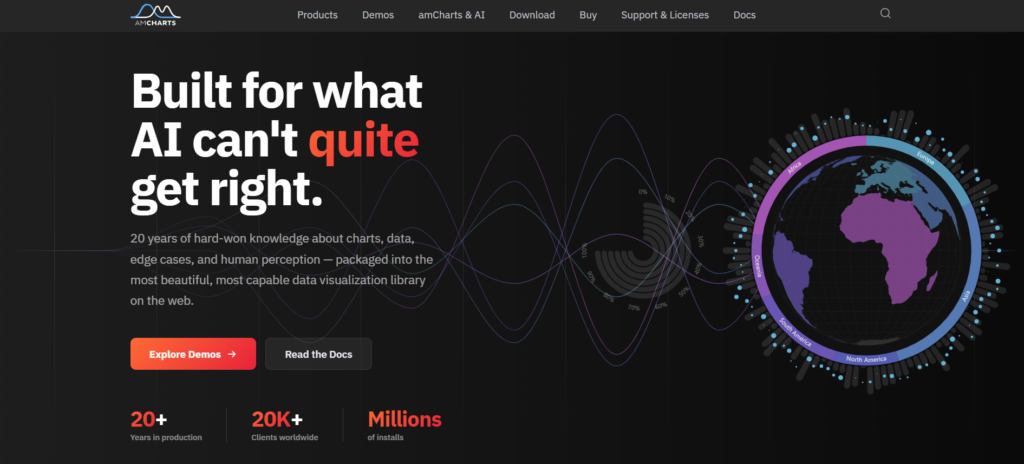
Established in 2006, amCharts offers twenty years of charting know-how to organizations working with live dashboards, financial data, and big data.
amCharts includes over sixty chart types, for financial, Gantt, and interactive maps, making it a rare choice that will not require you to integrate five different software options. Its rendering engine utilizes the Canvas API for optimal performance on large-scale datasets, avoiding DOM rendering issues that limit performance across other charting libraries.
amCharts is relied upon by more than twenty thousand companies globally, so you know this is a production-quality option if that matters for your situation. The number of visualization types is broad, so you do not have to integrate different chart types for stocks, timelines, and geos. The chart library is scalable. If you need a wide array of charts or a wide scope, consider amCharts.
Pros:
- 60+ chart types cover financial, Gantt, and maps in the library
- Canvas-based engine is designed for the performance of frequent updates
- 20,000+ companies rely on its reliability
Cons:
- Does not detail GPU acceleration or maximum datapoints supported
SciChart
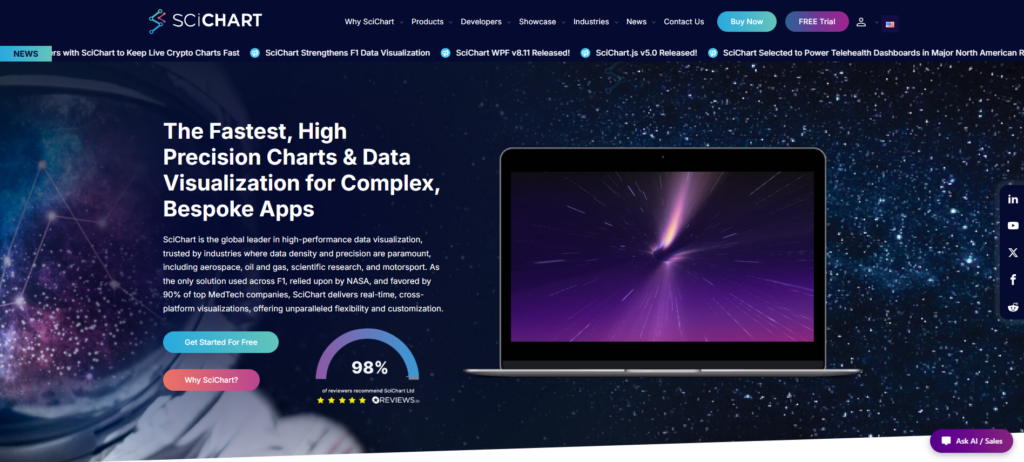
In 2012, SciChart was founded to address a problem that many other charting libraries were unable to solve: rendering vast amounts of data in production. With a proprietary Vx™ GPU-accelerated rendering engine, SciChart is able to render millions of data points at 60 FPS without any frame drops, which allows financial trading systems, IoT dashboards, and scientific visualization tools to meet the demands of responsiveness.
What makes SciChart stand out is that it can do all this without compromising functionality. It is available for WPF, JavaScript/React, iOS, Android, and macOS. Its JavaScript/React binding is implemented natively; thus, developers benefit from the full performance advantage of GPU acceleration without having to give up the benefits of a specific JavaScript/React binding. The performance is consistently great, even in the browser when visualizing hundreds of millions of data points.
SciChart is also one of the only charting libraries that supports a variety of chart types, including:
- 2D and 3D
- Geo-maps
- Gauges
- Polar Charts
- Heatmaps
Its API is also highly customizable and can be configured to your specific needs via an array of customization endpoints. The library is also popular among customers, as evidenced by the fact that it has received nearly 500 five-star reviews from its users on Reviews.io.
Users can easily find the information they need with the help of the library’s 170+ examples and demos, as well as its extensive library of documentation and a built-in AI assistant on every page of that documentation.
Highcharts
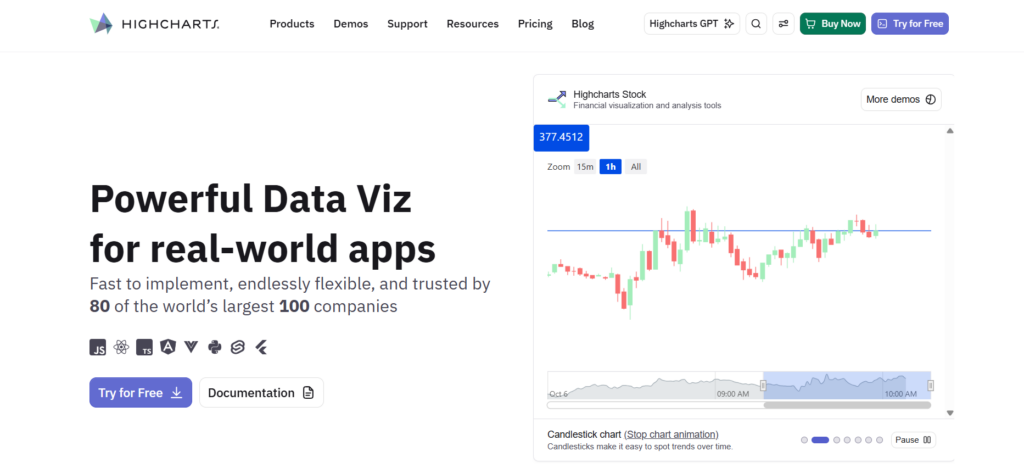
A complete package with Core, Stock, Maps, Gantt, Grid, and Dashboards, Highcharts really is the one to pick if you are planning to build a full-fledged ecosystem and not just a single chart library. Unlike the other solutions, the one thing Highcharts has done extremely well is focus on both a11y and framework integrations (e.g., React, Vue, Angular).
The world’s apps are not just one big chart. You’re likely to be embedding your visualization into an existing stack, and the last thing you’d want in that stack is inaccessible data (hello WCAG) or the inability to integrate with the framework you like.
On top of that, there’s plenty of enterprise-level support and documentation. Basically, if you are in the enterprise (reliability and compliance aren’t an afterthought to you), Highcharts is the one. It doesn’t pack the same power as some of the other choices in terms of raw GPU acceleration; however, in return, you’re getting better breadth, depth and polish in its features.
Which matters more to you, rendering millions of data points, or not breaking when attempting to render 50,000? It will probably be 50,000 when all things are considered.
Main features:
- Complete package (Core, Stock, Maps, Gantt, Grid, Dashboards)
- Framework integration (React, Vue, Angular)
- Accessibility-first a11y and WCAG
- Extensive enterprise-level documentation and SLA support
Priced privately, must get a quote, self-service isn’t an option
Fusioncharts
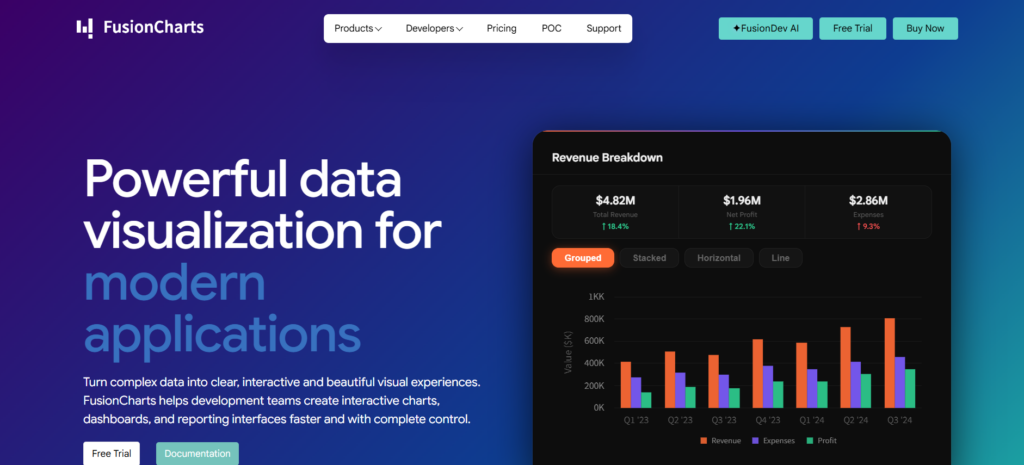
FusionCharts converts your data into great-looking visuals in minutes, not years. You may need to wait for the next version to see GPU-enabled charts, but the benefit is getting up and running quickly. With over 95 chart types and over 1400 different pre-built maps, you’ll find it covers most use cases.
It also includes over 20 dashboard templates for you to use as a starting point. If you have to build internal dashboards or report platforms that just need to be on time (but don’t require you to render datasets that are in the order of 100 million points), you’ll like the approach FusionCharts takes by focusing on breadth rather than depth.
What also stands out is how you can quickly plug FusionCharts into most major frontend development libraries. The API is consistent across all these environments. Whether you are using React, Angular, Vue, or Svelte, you will find it easy to use within the library.
The charts work equally well on the web and on mobile. FusionCharts will work equally well in environments that require a standardised charting library or that need the charting library to be built and iterated quickly.
Main features:
- Over 95 types of charts, ranging from financial and Gantt to geographic charts
- More than 1400 pre-built geographic maps for you to use right away
- Works on React, Angular, Vue, and Svelte with a unified API
- Includes more than 20 dashboard templates that you can build on top of
- It will work on most technologies for web and mobile
Weakness: There is no info published on the price. You will need to contact FusionCharts to get a quote.
Chart.js
Chart.js is an open-source, community-maintained project built on HTML5 canvas rendering and animations. It’s a go-to library if you just need a few charts and no licensing requirements. The library provides 8 basic chart types, as well as a mixed chart type. With Chart.js, you can implement custom scales, and you can configure responsive chart design options.
The library is lightweight, but its canvas-based rendering means that it isn’t performant for large data sets. You will start to see performance degradation when handling tens of thousands of data points in real-time. If you are building an internal app, an educational app, or a static data report, Chart.js may still be the best choice for you. It is open source, lightweight, and easy to use. However, if your app needs GPU or WebGL rendering and can handle millions of data points at 60 FPS, you will want to consider an alternative.
Pros:
- Open source and community-maintained
- Good for creating common charts quickly
- Responsive design options
Cons:
- No GPU/WebGL support
- Not performant for data sets greater than tens of thousands
Frequently Asked Questions
Q: Are there JavaScript chart libraries that can display 100 million data points in real time?
A: Yes. To do so, they require GPU acceleration or a rendering engine optimized for massive Canvas use cases. All others tend to slow down in the 10,000-50,000 data points range. Libraries capable of rendering 100 million points in real time while rendering at 60 FPS require GPU acceleration (e.g., WebGL) or a rendering engine that’s built specifically for large-scale data rendering.
Q: What are the costs for charting libraries?
A: Charting libraries have open-source versions that are free to use, but also versions that require licensing at $500 to $5,000 per seat per year, per application or enterprise, depending on your requirements. Always confirm whether your use case (internal dashboard or client-facing SaaS) triggers different pricing tiers.
Q: Can I use these libraries with my front-end frameworks (i.e., React, Vue, Angular)?
A: Most library vendors provide an official React and Vue integration. Angular is available from the library vendor and/or through a third party. Check the library’s developer guide for supported frameworks.
Q: How long does it take to render large datasets?
A: Initial dataset render should take a few milliseconds to seconds, depending on your hardware and how the data is organized. Real-time rendering should update in 16ms or less. Make sure you check the library’s demo using your actual data points and hardware type before making a choice.
Q: Do the library vendors offer free trials or sandboxes?
A: Most library vendors provide interactive demos you can run in your browser. For commercial libraries, a trial period of 14 to 30 days is typically available. Open-source libraries can be evaluated immediately, free of charge.
Conclusion
Performance matters. These five libraries prove that rendering a few million data points with no lag is possible now. Each has different approaches for GPU rendering, Canvas, and chart library features.
It depends on your priority: speed, options, or compatibility. Benchmark them with the largest data set, then select the one that looks better. Most teams will know the winner after a couple of hours.